September 16, 2015 – Vol. 10 Issue 3: Prop 39 and the Bad Rapp
In This Issue
Flanigan’s Eco-Logic
The Federal Clean Power Plan
Mass DOT Goes Solar
Almond Farming and CA Water
What to Drink?
The San Onofre Solution

Flanigan’s Eco-Logic: Prop 39 and the Bad Rapp
The Climate Smart Schools team is now working in five California school districts implementing Proposition 39, the California Clean Energy Jobs Act. For the past two years our team has been benchmarking, auditing, evaluating products, and creating smart energy management plans that serve the particular needs of each district.
Still, eighteen months in and not one of the districts have yet “broken ground” on construction. Wow. Does this delay mean that Proposition 39 is a failure? Far from it.
In August, the Associated Press (AP) authored a report that Prop 39 has failed in making good on the jobs it promised. Based on our experience, the real jobs are coming. In the next eighteen months, if our work is any indication, we can anticipate a major wave of energy efficiency work in California.
Energy plans have been approved by school district boards and by the California Energy Commission, a major hurdle. Checks have been cut by the California Department of Education. Money is about to flow.
In our pipeline, we’re shifting into implementation at five high schools and five elementary schools. On these ten campuses, there will be lots of workers replacing lighting, reprogramming and in cases installing more efficient HVAC. Those are real jobs. We’re also addressing pools, heaters, pumps, controls, and covers. Our job creation contribution as a result of implementation will be 31.8 full-time equivalent jobs and nearly a half million in energy and dollar savings in the first year alone.
And that’s just round number one. The work continues. We’re about to file a second round of Energy Expenditure Plans for the current fiscal year. And we have three other districts with their first plans ready to go. None of these plans have yet to be calculated for jobs and energy savings. When these milestones are reached, Prop 39 will have significant impact.
As a Prop 39 consultant – Climate Smart Schools – it’s hard not to defend the planning funds allocated. From our nonprofit vantage point, we don’t see any abuse of funds. Instead, we see a range of project types, from very basic retrofits to quite complex energy management projects co-mingled with other funds. One can paint a rich tapestry of approaches and concepts being put in motion thanks to Prop 39, all deemed cost effective by the infamous “SIR,” the savings to investment ratio.
Furthermore, the level of planning seems appropriate. Planning funds were capped for most districts at 30% of the first-year allocation, or some 6% of a district’s overall P39 five-year allocation. And for that amount, our districts are getting great value, roadmaps for long-term savings, complete with vetted and approved strategies for retrofit and generation projects, their financing and implementation.
When fully realized, and amplified by student and community involvement and action, Climate Smart School districts will realize significant savings, and many jobs and careers will have been created. We suspect that many districts up and down the state can talk about their successes.
Thanks to our involvement, and planning support, Climate Smart Schools is providing added value to districts: our schools are working on the nexus between energy and water and carbon. We helped one district win a $2 million grant for smart water management on campus. Students are getting involved. We’re exploring solar and energy storage. And with our utilities, we’re shaping up a Zero Net Energy project, transforming the science wing of one of our high schools into a living lab for students and the surrounding design community.
Sure, Prop 39 has its problems, but AP missed the mark. The real story is that the pipeline is being loaded. And yes, too many districts and schools are sitting on the sidelines. We urge them to jump in and to become a part of a successful school energy efficiency retrofit movement at this program mid-point.
Stay tuned. We look forward to reporting on actual retrofits, that take lots of workers and that will be resulting in lower costs for districts, while shaping careers in California’s clean tech arena.
The Federal Clean Power Plan
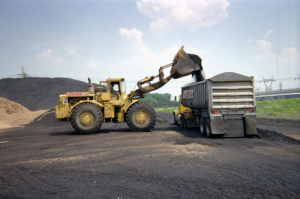 On August 3rd President Obama and the U.S. Environmental Protection Agency announced the Clean Power Plan. It “takes real action on climate change,” cutting carbon emissions nationwide 32% before 2030 from 2005 levels. Obama called the initiative as the nation’s most important step to address climate change. Federal officials hope that the Plan will leverage international adoption of similar rules. Detractors have called the initiative a “war on coal” with crippling economic impacts.
The EPA claims that the Plan was shaped by years of outreach and public engagement, and that it is fair, flexible, and designed to strengthen the trend toward cleaner and lower-polluting American energy. Each state has been given a mandate to achieve a specific 2030 emissions level target. For instance, the Plan calls for a 28% reduction in Colorado’s overall carbon dioxide emissions from 2012 levels.
The EPA website states that “greenhouse gas pollution threatens Americans’ health and welfare….” “That 2014 was the hottest year in recorded history, and 14 of the 15 warmest years on record have all occurred in the first 15 years of this century”…. “Overwhelmingly, the best scientists in the world… are telling us that our activities are causing climate change.” “Fossil fuel-fired power plants are by far the largest source of U.S. CO2 emissions, thus taking action now is critical.”
Despite this logic, as many as 20 states will be filing legal challenges to the Plan. The states will be joined by hundreds of trade groups, coal and power companies. It is expected to be among the most heavily litigated environmental regulations in history. The states will be joined by hundreds of trade groups, coal and power companies. They claim that the Plan unfairly targets existing coal-burning power plants and states whose economies are based on low-cost coal resources. Challenges will be received for 60 days and will then be consolidated by the U.S. Court of Appeals.
Here’s how the Clean Power Plan is slated to work: The Clean Air Act – under section 111(d) – “creates a partnership between EPA, states, tribes and U.S. territories – with EPA setting a goal and states and tribes choosing how they will meet it.”
States then develop and implement plans that ensure that the power plants in their state – either individually, together, or in combination with other measures – achieve the interim CO2 emissions performance rates over the period of 2022 to 2029 and the final CO2 emission goals by 2030. For those states that don’t comply and make plans, the EPA will plan for them as it has for other pollutant inactions, imposing mandates on specific emissions sources.
Mass DOT Goes Solar
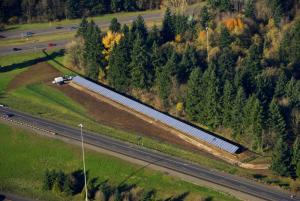
Solar along the Oregon I-5
Cruising the Mass Pike, one is struck by large, roadside solar arrays. They’re at exits, near service plazas, and on embankments. They’re in towns like Framingham, Natick, and Stockbridge. On my way to the Cape a few weeks ago, I saw another array in a cloverleaf off Route 3, Exit 5 in Plymouth. These MassDOT Phase 1A and Phase 1B “alignment solar” projects excite me. As a society, we seek unused land for power generation. We’re farming photons. Massachusetts roadsides are now multi-tasking!
At least one valiant effort to initiate similar roadside projects in California failed due to CalTRANS resistance. The agency’s legal department held up a project due to the cost of “air space leases,” which couldn’t be subsidized in any, way, shape, or manner, and a removal provision that gave CalTRANS the right to removal at any time in the 20-year contract term without retribution. Things are different in Massachusetts.
In Massachusetts – the Bay State, the Old Colony State, and the Codfish State – the MassDOT Office of Energy, Technology & Management and Highway Division are working collaboratively. The three-year Solar PV Energy Program is slated to sunset in 2016. Its goal is to build ground-mount solar generation facilities at multiple state-owned properties within the state highway system.
The program was driven by a vision and the desire to create energy savings, generate lease revenue, reduce GHGs, and support the Commonwealth’s green and clean economy. The program began with a program design and site feasibility study. A solicitation was issued to solicit best-value services to design, construct, commission, finance, operate, and maintain solar PV energy generating facilities. MassDOT selected Ameresco, Inc. to serve as the project developer. The two parties executed a master lease agreement and power purchase agreement in November of 2014.
MassDOT chose a “public-private partnership” business model to implement the 6 MW program as there was no upfront cost to the State. And Ameresco is fully responsible for the development, design, construction, commission, operation and maintenance of the solar facilities for the life of the contract. Its costs will be recovered over time in the form of solar renewable energy credits, federal tax credits and depreciation benefits, and electricity sales.
In this win-win, MassDOT has committed to purchase 100% of the solar power from Ameresco at rates lower than current utility rates. Given the PPA rate and the State’s virtual net energy metering policy, the project is projected to generate $15+ million over the contract period. MassDOT will also receive annual rent payments for the developer’s leasing of the land supporting the facilities.
Almond Farming and California Water
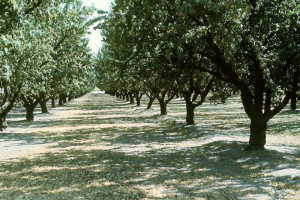
California almond orchard
One of the most intriguing trade-offs I’ve encountered of late relates to almonds, and almond milk in particular. First and foremost, almonds are a very healthy food. If you could only eat one thing, almonds would perhaps be your best choice. And like so many of us, I’ve uncovered the upside of almond milk, a great dairy substitute that really tastes good. But it’s one with huge water implications. Can we drink almond milk without guilt?
Technically, almonds are the seed of a fruit of an almond tree. They are referred to as nuts. They’re loaded with nutrients that combat respiratory disorders, constipation, coughs, and heart problems. They’re also loaded with minerals including manganese and copper, Vitamin E and fiber, phosphorous, and riboflavin. Almonds are high in mono-saturated fat, low in saturated fat, and have no cholesterol. Their healthy fats help you lose weight and they taste great.
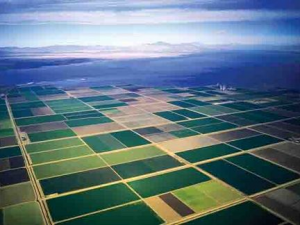
Fields of Imperial Valley, CA
As a result, almond production is booming. We’re eating ten times as many almonds as we did in the 1960s. “Almonds are the new peanuts.” Almonds grew from a $1.2 billion market in 2002 to a $4.8 billion market in 2012. The average American now eats about two pounds of almonds per year, twice the amount consumed a decade ago, while the vast majority of almond production is exported. Growth of exports to Hong Kong and China more than quadrupled between 2007 and 2013.
Today, almond production is the king of California agriculture. It’s one of the highest-value crops from a rancher’s perspective. Its acreage has doubled since 2005. According to the Pacific Institute, almonds generate $1,200 of value per acre foot of water each year. Alfalfa production – California’s number one absolute use of water — on the other hand, is both intensive and unproductive, generating only $175 for every acre foot of water used. Rice generates $374/acre foot.
But there is a downside: Almond production consumes more water than all exterior landscape watering in the Golden State. Similarly, almond production uses more water than all indoor water use in California. Almond production makes up 13% of California’s 7.9 million acres of irrigated farmland. This production requires 9% of the State’s water for agriculture, 3.30 million acre feet of water per year, or 3.5 billion cubic meters. Remarkably, about the same amount of water is used to grow almonds in California as is used by the Los Angeles and San Francisco metro areas combined.
California is in its fourth year of drought and with supplies dwindling, every form of water use is on the table for conservation and efficiency. The biggest use by far, is agriculture. It requires 80% of the State’s water supplies. While a massive proportion, California is the nation’s vegetable garden. The Golden State produces major percentages of the nation’s produce. Pre-drought, California grew 99% of the nation’s almonds and walnuts, 98% of all pistachios, 95% of all broccoli, 92% strawberries, 91% grapes, 90% tomatoes, and 74% of all lettuce.
In a time of drought, almonds and other agricultural products have been in the spotlight, even vilified. It takes 1.1 gallons of water to grow an almond. Almonds’ defendants claim that their trees are no more thirsty than other fruit and nut trees. It takes 4.6 gallons to grow a walnut. And farmers have replaced annual crops like tomatoes and melons in favor of perennial almond orchards that can’t lay fallow in drought years.
The crop that uses the most water in California is alfalfa, largely grown as feed for cattle and dairy cows, irrigating pastures. There’s a lot of embedded water in beef and hamburgers, in California that’s 2.7 trillion gallons a year. In terms of acre-feet water, alfalfa to feed cattle tops the list consuming 5.2 million acre feet per year.
What Kind of Milk to Drink?
 It wasn’t that long ago that being a milkman was a career option. And only one kind of milk was in the truck. But today, there’s whole, skimmed, almond, rice, and soy and more. Dairy milk per capita dropped by 25% from 1975 – 2012. Since 1999, alternatives’ growth rates have been 10% annually. But now the drought. The plot thickens. Which is best for you? Which is milk is best for our society in time of drought?
It would appear that almond milk – at 1.1 gallons per almond – would be the worst, the most water-intensive milk produce. But further investigation finds that almond milk is made by blending soaked almonds with water and flavoring agents. Most of the milk-like product is water, not almonds. Most commercial products include a sweetener, be it honey or sugar. A pound of almonds is nearly 377 almonds. If the milk were 100% almonds, it would require over 400 gallons of water to produce. But commercial almond milk products are reportedly only 1 – 2% almonds.
Homemade almond milk recipes are “thicker” and call for ¼ – 1/3 of a cup of almonds for every cup of water. Homemade almond milk may require 50 – 60 almonds per pound product. In both of these scenarios, almond milk is preferable to dairy from a water standpoint. Dairy milk requires 90 – 120 gallons per pound in its production.
And there are other alternatives. Soymilk is made by blending re-hydrated soy beans with water. While its high protein is attractive, it does not have the robust health value as dairy or almond milk. Rice milk is another tasty option, high in carbohydrates and low in protein.
So… drink what appeals and what nourishes the body. A January 2015 Mother Jones article ripped on almond milk, telling “ignorant hipsters” to lay off. First, the article claimed, almond milk lacks the nutrition of dairy milk. Second, it’s mostly water with flavors and sugars.
There are trade offs in each case. Dairy is especially good for bone development in younger years. Later, lower cholesterol alternatives may be desirable. There are strong lactose-intolerant alternatives. While difficult to calculate, and others’ results conflict, it does not appear that one’s choice of milk will impact California’s drought in any significant way. We’ve got bigger fish to fry!
Renewable Energy Certificates
Renewable Energy Certificates are also known as renewable energy credits, green certificates, green tags, and tradable renewable certificates. A Renewable Energy Certificate (REC) represents the legal property rights to the environmental, social, and other non-power qualities of renewable electricity generation.
How Do RECs work?
Grid-tied electricity generators produce two distinct products: “physical electricity” and RECs. These two product components can be sold together or separately, “bundled or unbundled.” Since electrons from all generation sources are indistinguishable, it is impossible to track the physical electrons from a point of generation to a specific point of use. RECs serve the role of tagging certain amounts of renewable generation, laying claim to the green and social attributes of renewable-based generation.
As renewable generators produce electricity, they create one REC for every 1,000 kilowatt-hours (or 1 megawatt-hour) of electricity placed on the grid. They can retain the RECs or sell them. If the physical electricity and the associated RECs are sold to separate buyers, the physical electricity is no longer considered renewable.
Green-e is the nation’s leading independent consumer protection program for the sale of renewable energy certificates. In 2013 Green-e Energy certified 33.5 million megawatt-hours (MWh), 1% of the total U.S. electricity mix. Over half of the installed wind capacity in the U.S. is participating in Green-e Energy certified transactions.
The Value of RECs
RECs provide value to both buyers and renewable project developers. For buyers, RECs are a means of procuring green power attributes from off-site locations at low cost. This allows organizations like Whole Foods, REI, and others to support renewable energy projects.
Green building professionals purchase RECs to qualify for the LEED Green Power Credit. And they do so at a fraction of the cost of developing and operating their own renewable energy projects.
For green power project developers, sales of RECs offset project costs. RECs enable individuals and organizations to channel funds to green power projects. Purchasers of RECs provide developers with a revenue stream that supplements the revenue they secure from the sale of the project’s electricity. This “additional revenue” improves renewable energy project economics.
Compliance and Voluntary Markets
There are two fundamental forms of REC markets, and their prices are vastly different. Voluntary markets provide corporations, universities, and others with means of buying RECs and to make the claim of being 100% green powered. Most corporate and household purchases of renewable energy are voluntary purchases. Rates for RECS purchased through Arcadia Power are about a penny to a penny and a half per kilowatt-hour, less than 10% of the cost of physical power.
Here’s a peek at REC products available for purchase in the voluntary market: U.S. Green Power RECs are sourced from renewable energy projects. U.S. Wind RECs are generated at wind farms. Regional Green Power RECs support renewable energy projects in specific regions of the United States and Canada. Catalyst Wind RECs are sourced from wind farms coming online in 2011 and 2012. Brighter Schools Solar RECs are produced by photovoltaic solar panels installed at U.S. schools.
Renewable energy generators located in states that do not have a Renewable Portfolio Standard can sell their RECs to voluntary buyers. These RECs have been very cheap. Over the past four years, prices for voluntary renewable energy certificates have decreased, now at about $1.20/MWh. The voluntary green power market totaled more than 62 million MWh in 2013, with about 5.4 million customers participating. The supply continues to be dominated by wind, though solar is increasing its share of utility green pricing programs.
The prices of RECs in “compliance markets” are much higher. Compliance markets – now in 29 states and the District of Columbia – are created by Renewable Portfolio Standards. Electric utilities in these states must demonstrate compliance with their requirements by securing and purchasing RECs. For instance, California utilities are required to achieve 33% of electricity sales using certified renewables by 2020.
Compliance market costs have resulted in REC prices that are generally in the $40 – 60 range. Solar RECs (SRECs) have been used in a number of states to incentivize solar and to spur a REC market. This led to dramatic prices, at one point up to $665/MWh in New Jersey and more than $500 in Massachusetts. Four years later that New Jersey SREC price fell to $160. In Delaware, the spot price for a 2010 SREC was $255 in July 2010 and about $50 in May 2014.
California’s Compliance Market
California requires utilities to adhere to its Renewable Portfolio Standard. To adhere to the State mandate, utilities are required to obtain RECs from specific sources, or “buckets.”
Bucket 1: State policymakers determined that the top RPS priority is to tap renewable energy resources within the state. In-state, bundled resources interconnected with a California Balancing Authority, are Bucket 1 resources. Bucket 1 RECs must constitute 65% of RPS-compliant RECs by the end 2016 (compliance period 2), and 75% thereafter in compliance period 3. (Some out of state projects may qualify for this bucket.)
Bucket 2 resources are “firmed or shaped transactions” that combine a renewable source like wind, with a traditional energy resource. This form of “renewable energy” is valuable from a grid standpoint, but less preferential from an environmental standpoint. It maximum share of RPS-eligible projects drops from 35% to 25% by 2020. Bucket 2 includes renewable energy generated outside California scheduled into a California balancing authority through a transmission arrangement.
Bucket 3 RECs is anything else, including TRECs, tradable renewable energy certificates like those in the voluntary market. This unbundled category of RECs can provide a maximum of 25%, then dropping to 15%, and ultimately 10% of the RPS-eligible generation by 2020.