April 18, 2017 – Volume 19 #3: Essays on Senses
In This Issue
Flanigan’s Eco-Logic
The Dawn of Vertical Forests
The Tiny House Movement
Clarifying RECs and Carbon Offsets
Energy Efficiency Workforce
Clean Energy Trumps Dirty Sources
Duck Curves and Changing Peaks
Westmont Solar Project Video

Flanigan’s Eco-Logic: Essays on Senses
Leaving Inman, speedwalking, heading up Broadway. It’s Cambridge, a month ago. And I’m on foot, all alone, and in a blizzard. No worries, I’ve just had a great meal, left the kids’ warm home… heading only ten blocks or so to our Harvard Square Airbnb.
It’s intense… I’m breathing in snow, it’s cold, I’m unprepared. My face is white, snow melting down my neck… Terry would hate this! Yet, I smile, I think of psychologist and teacher Herb Leff and his cognitive sets. Look at this for its best virtues. I’m from California. This is cool, really cool, literally and figuratively. How often does someone from LA get caught in a white out? Gotta love it, embrace it, breathe it in. How lucky I am. Then quickly, I’m in a heated vestibule… the experience over, cold fades to wet, and then wet to dry.
“Dad, you did a really good job,” said my daughter Skye. I was honored to have been asked to be a guest lecturer at the Harvard Law School, for its brand new Climate Solutions Living Lab. And I was happy that my two-hour seminar went well, students were fully engaged, one of my very best critics pleased and likely relieved.
The Living Lab’s students come from a number of disciplines – from the Law School, the Business School, the School of Public Health (where Skye works), Engineering, and the Kennedy School of Government. I present means of innovative financing for clean energy… and use two current clients as case studies for the class, EcoMotion’s work with creating microgrids and PERCs at 12 school sites in Monterey and Santa Clara counties. Father-daughter, we walk through the main quad, then down Mass Ave. to a delectable and hip Cambridge restaurant.
Flying into the Bay Area… the hills so verdant, so green. They’re mellow, soft, rolling contours… so different from the dry and rocky geography around LA. The morning sun makes the landscape idyllic; shadows poetic. Gotta love the Southwest commuter experience.
From my aerial standpoint, I see that this paradise is just miles from the busy Bay Area civilization. Jeep trails run everywhere, there are a few homesteads, private all but from the air. We land in Oakland where pilots seem to have more license to wheel the planes around like parking garage attendants. Deplane, pass wine bars, 15-minute masseurs.
AirBart, the infamous bus ride from hell (well from the airport to BART’s Oakland Coliseum stop) is two year’s gone, replaced with a sleek light rail system, the 3.2-mile Oakland Airport Connector. It’s an “autonomous cable-driven system” built by the Austrian company Doppelmayr. We momentarily stop at the center-point wheelhouse to switch from one cable to another. Sure, critics say it cost too much to build ($464 million), and now that it costs too much to ride ($6 each way), but BART officials are pleased with its operation and airport officials see an uptick in airport passengers.
Going to visit Advanced Microgrid Solutions; excited I am. CEO and Founder Susan Kennedy is sharp as a tack, on fire leading her company’s transformative role, and a friend. I walk from the Montgomery BART station, passing restaurants and watering holes. It’s St. Patrick’s Day and I think of Sheilds, fellow Irishman. He introduced me to AMS. Don’t think I’ll drink any green beer today, but lots of young San Franciscans are! A sunny and warm day in the Bay Area it is and the sun-starved are out in droves.
The AMS office is hip and happening. Black walls accentuate grey and white patterns, open seating, glass bull-pen offices, break areas fully stocked with healthy snacks. I have a kombucha. Susan gives me a tour of her growing operation, over 50 staff now. I meet engineers and programmers; AMS now has three lawyers. AMS is installing battery banks – notably Tesla PowerPacks – with super-smart controllers at facilities across the country. Its business model is one of fully financed systems, with savings guarantees for host sites. We hit the roof deck to discuss EcoMotion’s PERCs, Powered Emergency Response Centers.
Home, Glendale… one of LA’s original bedroom communities. I check our new solar system to be rewarded by how much power we’ve generated that day. On weekends, I check several times a day. I’m a bit obsessed. This is our third solar house; this system powers 100% of our electricity use. Our 7.8 kW system is testing two kinds of panels, 300-watt Silfab panels and 300-watt frameless, bifacial Sunpreme panels that collect photons of sunlight from above and below. Our Delta inverter is silent; no annoying “sound of power.” Feels good to own and operate a carbon-free power plant.
I arrive early, unlocking the front door to the P. Intercontinental Building here at Pershing Square in Los Angeles. This is a classic old building. I take the old and creaky wooden stairway to the second floor, to EcoMotion’s new office. The hallways are fresh, newly carpeted, and brightly lit with LEDs. The building was built in 1907, there’s old wood molding, a well-used sense to this four-story relic among LA’s giant skyscrapers. My office is spacious with exposed brick walls, a large operable casement window with a view of the tree outside and Olive Street scene below.
Quote of the Week
“How do you combat the ills of poor air quality and pollution in a massive city of over eight million people, where there’s hardly room to plant new trees? You build a forest straight up into the sky.”
– Mike Wehner, BGR Media
The Dawn of Vertical Forests

Source: Stefano Boeri Architects
China is out to build a fleet of the most nature-incorporated architectural structures in the world. Construction has begun on Asia’s first vertical forest – the Nanjing Vertical Forest — and is expected to be complete by 2018 thanks to the architectural vision of Stefano Boeri. His vision is to build green settlements of 100 – 200 buildings each, of different heights and sizes, all featuring green rooftops, balconies, and facades. Imagine how city skylines will change colors through the seasons.
The Nanjing Vertical Forest will be similar to Milan’s famous vertical forest building known as Bosco Verticale. This was Boeri’s first vertical forest, consisting of a pair of residential towers completed in 2014. His firm then designed a second demonstration of “metropolitan reforestation” in Lausanne, Switzerland. Boeri points out that his vertical forests have lots of benefits, including creating microclimates, beauty, and muffling noise.
Boeri’s third vertical project is Nanjing Green Towers. Two green towers will stand over the city in the Pukuo District, covered in over 1,100 trees constituting 23 local species, and 2,500 cascading plants. The towers will have 64,600 square feet of planted area. The greenery is expected to absorb 25 tons of carbon dioxide each year while producing 130 pounds of oxygen each day. Serving as green air filters, they will also suck up toxic smog.
Critics point to the need for a more thorough analysis: Buildings that can handle the additional weight of soil and forests will have to be built stronger, requiring more CO2 producing cement. And water will be required for the plants to thrive… another scarce input in many places. But proponents claim that these structures are anti-sprawl devices. They point out that the vertical forests are a viable alternative to urban sprawl.. which is also heavy in its use of concrete. These are alternative urban environments. They allow residents to live close to nature, typically achieved by commuting and living in the suburbs.
In related news, the Via Verde Project in Mexico is transforming highway pillars with plants that cleanse, beautify, and hopefully lower driver stress.
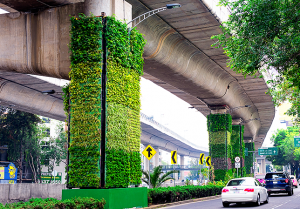
Source: Via Verde
The Tiny House Movement
Check ’em out online. You can build one for as little as $2,000, or buy one for $10,000 and way up! The Little Cottage Company will send you one for $3,199 with free shipping. It’s a new movement. According to Forbes, tiny houses “are having a moment.” The tiny house movement has gone huge. They are inexpensive, ecologically motivated, and force owners to change their lifestyles… reducing possessions and tying into the de-clutter movement. They’re part of the quest for simplicity, a rejection of stuff and waste. Experts note that the movement has appealed to a surprisingly broad demographic.
The typical American home is around 2,600 square feet, whereas a typical tiny house is 100 – 460 square feet. This bucks a trend: In 1978 the average American house was 1,780 square feet in size. This grew to 2,479 square feet by 2013 despite a decrease in the size of the average American family.
The “small house” movement is for homes less than 1,000 square feet in size. “Tiny houses” are generally less than 500 square feet. Tiny houses on wheels have also gotten lots of attention at about 96 square feet in size. They often have the cabinetry reminiscent of the galley in a sail boat.
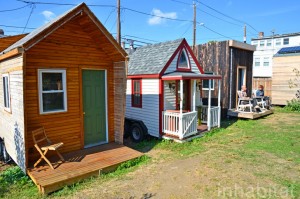
Boneyard Studios Tiny House Village
In 2002, the Small House Society was formed. Then in 2005, and after Hurricane Katrina, “Katrina Cottages” were developed that were 308 square feet as alternatives to FEMA trailers. There have been reality TV shows, Tiny House Nation and Tiny House Hunters. There are even tiny apartments in New York and San Francisco.
Yes, tiny houses are more affordable and they are certainly ecologically friendly… but in fairness, they are a tiny part of real estate transactions. Less than 1% of new sales were for homes of less than 1,000 square feet in size…often in the form of “accessory dwelling units” for mother in laws.
Tiny they are, but in terms of cost per square foot, they can be quite expensive, in the $200 – $400 per square foot range. Why? While compact, tiny houses still have all the expensive mechanicals of a “normal” home…appliances, bathrooms, etc.
Clarifying RECs and Carbon Offsets
Many of us are confused about the difference between RECs and Carbon Offsets. They are both good tools to cut greenhouse gases (GHGs). They both represent new market mechanisms to clean our air and to mitigate the effects of global climate change.
Environmental Market Mechanisms
RECs = 1 MWh
VER / CRT = 1 Metric Ton of Carbon
They are parallel and related, but distinct, environmental markets — the market for Renewable Energy Certificates (RECs) and the market for Voluntary Emission Reductions (VERs), also known as carbon offsets.
RECs
First off, RECs only focus on electricity. A renewable energy certificate represents 1 MWh of renewable energy, be it solar, wind, geothermal, etc. A REC represents the environmental attributes of clean power. So when you buy a REC, you are buying the rights to claim that you are using clean power even if the REC comes from an energy source very far away. For instance, you might buy wind RECs from the Midwest, or solar RECs from California or New Jersey to offset your electricity emissions in Vermont or Maine.
The carbon offset value of a REC can vary. For instance, a REC that is offsetting one utility’s power mix in the coal-rich Midwest might cut carbon more than a REC offsetting another utility’s rather clean power mix, say in California. So when you buy RECs you can offset your own emissions (kilowatt-hour by kilowatt-hour)… but the amount of carbon being offset can be quite different depending on the type of RECs you buy.
REC prices depend on a number of factors, including the technology, the vintage (year in which it was generated), the volume purchased, the region in which the generator is located, whether they are eligible for certification, and whether the RECs are bought to meet compliance obligations or serve voluntary retail consumers. REC prices in compliance markets are much higher than in voluntary markets. Voluntary RECS are in the 50 cent – $2 range, compliance more like $40 – $50.
There are three categories of RECs in California: Categories 1, 2, and 3. Category 1 RECs are from bundled resources. Category 2 RECs are from firming/shaping resources. Category 3 RECs are unbundled. There are three compliance periods through 2020… noted by the phasing out of unbundled resources. California ushered in “tradable RECs” (TRECs) in 2010. California utilities can use these to achieve up to 25% of their Renewable Portfolio Standard… that drops to 10% in 2017.
So who is really green? Who gets the green bragging rights?
If the RECs are unbundled and sold separately, then the purchaser of the RECs has bought the legal right to the renewable attributes they represent. This means that the energy originally associated with the RECs can no longer be considered renewable or to originate from a renewable source. For example, if homeowners were to sell the RECs associated with the energy generated from their rooftop solar PV installations, then those homeowners cannot legitimately claim to be using renewable power in their homes. Only the purchaser of the RECs can make that claim.
Carbon Offsets
Carbon offsets are more finite. A carbon offset – known as Voluntary Emissions Reductions (VERs) or Carbon Reduction Tons (CRT)… represents a metric ton of carbon regardless of its source. And carbon offsets must be verified. Climate Action Reserve is a leading verifier of RECs, be they from forestry projects, methane capture, etc.
Offsets also face strict rules, including the requirement that “the emission reduction credited be real, permanent, verifiable, and most importantly, additional to a business-as-usual scenario.” This “additionality requirement” is central to ensuring that the ton you emit is really offset by a new action to reduce carbon. RECs, however, are not subject to this additionality requirement. In contrast, RECs can come from “business as usual” renewable resources… those that are already built or those that are in compliance markets where the RPS has already been met, and whose owners seek to recover some development costs through the sale of RECs.
The question of Offsets vs. RECs is not a question of better or worse. Offsets and RECs are simply different players in a similar game. Both represent the environmental benefits of certain actions that can help mitigate climate change and reduce reliance on fossil fuels.
Energy Efficiency Workforce
 In the last issue of EcoNet, we reported on the number of jobs in the clean energy industry… values that clearly depict the rise of jobs in the renewable energy industry… long ago dwarfing jobs in fossil industries. But a silent resource was left out of the discussion: Energy efficiency – the least-cost energy resource — employs many more workers than renewable energies combined.
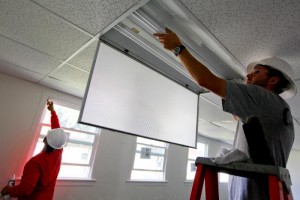
A new report finds that in the United States, millions of workers are employed in the energy efficiency business. It’s a remarkably diverse field and workforce, ranging from appliance manufacturers and home retrofitters to cloud-based energy management service providers… making such a tally hard to refine.
E4 The Future and Environmental Entrepreneurs found that ~1.9 million people worked full- or part-time on energy efficiency last year. E4 found that total was set to increase by almost a quarter of a million this year, making energy efficiency the largest industry in the clean energy economy. It employs twice as many workers as the auto industry (including auto parts manufacturers), and almost 10 times as many workers as the oil and gas extraction industry. According to the American Council for an Energy Efficient Economy (ACEEE), “it’s a big number.”
Clean Energy Trumps Dirty Sources
This past week, I asked several of my friends and colleagues to guestimate the percentage of new global generating capacity that is renewable. Several made single-digit pronouncements; one went as high as 20%.
According to UN Environment, the Frankfurt School-UNEP Collaborating Center, and Bloomberg New Energy Finance, 55% of new global generating capacity came from clean energy in 2016. The report added that the cost of clean energy continued to decline in 2016, and that the total invested in the sector fell 23% from 2015 levels to $241.6 billion because equipment got cheaper.
The cost of wind and solar continues to fall. According to Xcel Energy Vice President of Strategic Revenue Initiatives, Alice Jackson, wind became Colorado’s cheapest energy source in 2015.
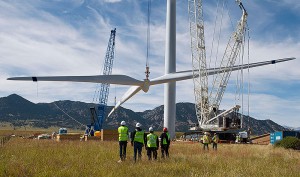
Wind Turbine Installation in Colorado
Duck Curves and Changing Peaks
 Is the sky falling on solar yet again in California? Yes, maybe no… But a January CPUC decision will likely take the wind out of the sails – i.e. deflating the investment returns — of many a future net-metered solar project here in the Golden State. For those that just went solar, relax, your solar revenue stream will be protected. You will be grandfathered.
But let’s look forward: California’s investor-owned utilities have convinced the California Public Utilities Commission officials to change the peak periods in California to better match today’s grid loads. Instead of summer peak being from 12pm – 6pm or 2pm – 6pm, the new peak periods for SCE and SDG&E will be from 4pm – 9pm, and 5pm – 10pm for PG&E…largely after solar generation expires for the day. Now the debate at the CPUC is on grandfathering, who gets to be grandfathered for this change and for how long.
We pow-wow with solar expert and EcoMotion friend, Christian Campisi. Is the sky falling? Well, no, but again it will be tougher to meet investors’ thresholds. And what have we been through as an industry? Nothing short of a “solarcoaster!” The CSI is but over… no more solar incentives in California. The ITC was threatened, and extended. NEM 2.0 – which would give far less than retail value for net energy metering – was watered down by CPUC President Picker, in favor of distributed solar. Now DG faces another foe… the duck curve!
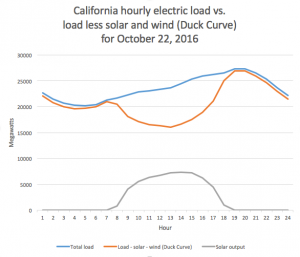
The duck curve sounds cool, doesn’t it? The graph represents how a preponderance of daytime renewable power – largely from utility-scale solar – is and will dramatically change the load profile of most California utilities. Instead of needing peak capacity during the heat of the day, now it’s largely in the evening when the sun goes down and consumers ramp up evening activities.
 So how does changing the peak period affect solar? Simple: For any solar producer hoping to get credit for high-cost peak power – for instance a school that is shut during the summer – the producer gets less credit to offset winter usage. Gone also will be rooftop solar’s potential to reduce peak period demand charges. “Storage is truly going to be the technology that solves the duck curve, but it’s going to take several years to get there,” notes Christian.
How to get around this? We kick around strategies: First, there are lots of consumers and corporate citizens that want to go solar despite potential changes to its economics. “Business owners still want to do something about their high electricity bills and to do the right thing around sustainability.” Second, let’s focus our solar works within the territories of municipal utilities that are exempt from the change. Third, work with industries that have constant loads and that will always and immediately consumer all solar power, regardless of when it is generated (thus no NEM). Fourth, push the legislature and the CPUC for effective feed-in tariff pricing to avoid the vagaries of net metering and offsetting different loads and rate structures.
Fighting this latest challenge to DG may also make sense. The Solar Energy Industries Association is reportedly readying for battle on this latest assault on distributed solar energy. What happens in California will likely be emulated across the country. Clearly, success with utility-scale solar is now at odds with distributed solar… when we need both wedges of mitigation measures. Some advocate special rates for DG plus storage.
Fighting it is aligned with Governor Jerry Brown’s stated energy goals and the State’s climate action plan. To meet the AB 32 challenge, a host of mitigation measures are on the table. One is the Governor’s goal for 12 GW of “localized” or distributed generation. The CPUC’s new decision will only challenge that goal’s timely success as it will retard the value of many solar systems…in turn, retarding the uptake and penetration of distributed generation. Analysts suggest 20 -40% less value for system in the PG&E service territory; perhaps more like 20% in Southern California. But Christian summarizes a sentiment we all hope we can share, that “I don’t see the CPUC and state standing-by and letting the solar industry die a slow death.” Stay tuned, there’s more to come.
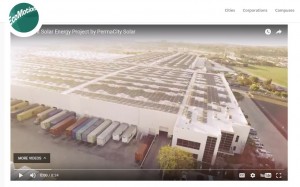
Westmont Solar Energy Project Video
On November 15th, EcoMotion’s guests witnessed the construction of the largest rooftop solar installation in the world, in San Pedro, California. The 50-acre project features 16 MW of solar… tens of thousands of Sunpower, Sunpreme, and Silfab panels, all captured with rooftop and drone footage. Westmont also features SolarStrap, an innovative and efficient rooftop racking system, and a veteran workforce. Power from the facility will feed into the LADWP grid, the facility’s owners get new roofs, new skylights, and annual roof lease payments for 20 years. The 8.5 minute video produced by EcoMotion – in partnership with Versatile Productions – can be seen on EcoMotion’s website.