October 2014 – Volume 16, Issue 7: New England in Full Fall Glory
IN THIS ISSUE
Flanigan’s Eco-Logic
A Legend in Sustainability: Tony Cortese
U.S. Solar Highlights 2014
Campus Solar Leadership 2014
The EcoMotion / AASHE Special
Reactive Power: kVAR and the Foam on the Beer
Visiting Noribachi’s Custom LED Manufacturing Facility

Flanigan’s Eco-Logic: New England and Full Fall Glory
The magnificence of fall in its full glory – the maple, ash, cherry, and birch trees on fire in color – is hard to fathom. Vivid reds, oranges, yellows… this is the world of color! I was in New England to visit seven campuses in Massachusetts, Rhode Island, Connectivity, and New York, the heartland of higher education in America.
Sustainability is coming into bloom as well on campuses, particularly in New England. Impressive steps have been taken by early adopters, and now widespread adoption of sustainability principles and practices is starting to take hold. In many cases, it is saving campuses money. The movement is in earnest, providing opportunities for students to plug in, to be engaged, and to shape their careers.
Road trip: I drive up Vermont’s Route 12 basking in the beauty of New England in fall. Cool nights are causing the chlorophyll in leaves to leave, allowing the pigments obscured by the green chlorophyll to be seen. These are yellow (xanthophylls) and orange (carotene). Some cold nights cause some trees to produce another pigment – anthocyanin – which is red! All framing landscapes marked with black and white cows, big red barns, green grass, the bluest skies with cumulus clouds bursting high above. Covered bridges that only appear in movies and calendars, abound, and they’re still in use.
A chill in the air… for those that live here and persevere each winter, it’s time to bring in the firewood. As Banjo Dan sang, it does indeed warm you three times… when you chop it down, when you buck it up, and when you sit with your sweetie by the fire at night!
I’m passing through, taking in the countryside. I reminisce, walks in the vibrant colors of the autumn woods, climbing Camels Hump. I soak it in, and take a back road to the 1700’s farmhouse I lived in during grad school at UVM. The silver and red maples ablaze.

Ziggy Marley? My New England tour began in Hampton Beach, New Hampshire, across the Blackwater River from the 1,244 MW Seabrook Nuclear Power Plant. Though plans for its second unit were scrapped, Seabrook today is the largest power plant in New England. I protested there years ago; it was in 1978 that the Clamshell Alliance occupied the site. One unit was built, cost $7 billion, was delayed for a decade, and bankrupt Public Service Company of New Hampshire, the fourth largest corporate bankruptcy in American history. The plant is within shot of a crowded beach town with insufficient two-lane road access and egress. Guess everyone just hopes for the best. I’m not totally at ease sleeping so close to a reactor.
The cold Atlantic beats New Hampshire’s few miles of coastline. Hampton Beach is deserted in winter, well, that’s until Ziggy Marley comes to town! Born David Marley in 1968 in Kingston, Jamaica – the eldest son of legendary Bob Marley and his wife Rita – he was taught to play drums and guitar by his dad. With other family members, they recorded together. Ziggy was 10 years old.
Today Ziggy Marley and the Melody Makers have a big sound, big bass. Like his father who died in 1981, Ziggy’s smile is contagious, his 25-year message clear. “Love is My Religion” still goes round in my brain. The crowd swayed to the music, just as did when I was at one of Bob Marley’s last shows. That was Tanglewood; Bob Marley was on the One Love tour.

Heading north to Vermont. The interstate winds through thousands of acres of New Hampshire forests. I pass the wood chip plant. There’s a lot of wood here. I cross the Connecticut River to be home in Vermont. Ahead of schedule, I duck off Interstate 89 and take Route 4 west… over the 165-foot deep Quechee Gorge. In Woodstock I wrap around the green before taking the turn at Gillingham’s Country Store to head north on Route 12. Now I’m soaking up the colors, drinking it, breathing it, true eye candy… perfect timing.
Family in Vermont, kids growing up, playing bass, tuba, and video games. My brother and his son are now working for competing solar companies! Customers of Vermont’s largest utility – Green Mountain Power – are assured 6 cents per kilowatt hour to make the minimum net energy metering rate 20 cents. My solar colleague calls that, “net energy metering on steroids.” It shows as one drives around the state. There are installations around every corner.
The Green Mountain State is just that: green. Burlington Electric claims to be 100% carbon-free! We hit Church Street, teeming with street musicians and strollers. The Onion River Coop where I shopped as a student grew up. It moved downtown and now looks a lot like a Whole Foods, but is community owned. Vermont has it together. We play tennis at 6:00 AM.
Back to Cambridge. Over the next four days the EcoMotion Campus Services team visits seven campuses, all vying for prestige and prominence in the green space. All are considering solar – two installing systems. Others have taken progressive steps: One campus features a wood chip plant that heats the entire campus; another one – so very strong in sports — realizes that it also needs to be green to compete for students. One school has abandoned its aging heating plant in favor of distributed high-efficiency gas boilers. We visit with National Grid to explore utility partnerships on campus; and with a newly capitalized company in Boston that is providing energy efficiency PPAs.
Oysters, fall beers, pumpkins grown large in the fields, and shades of autumnal glory. The Head of the Charles regatta features crew from all over the country. Connecting with staff and family, it really is a splendid time to be in New England. And for the green movement, it’s an exciting time, a time of growth, “social innovation,” and increased attention in all spheres of sustainability.
 |
| Sierra and Talia at the woodchip plant |
Quote of the week:
“What if higher education were to take a leadership role, as it did in the space race and the war on cancer, in preparing students and providing the information and knowledge to achieve a just and sustainable society? What would higher education look like?”
A Legend in Sustainability: Tony Cortese
Tony Cortese
Certainly a highlight of the New England trip was having lunch with Tony Cortese, a warm and wise gentleman who is an unparalleled leader in campus sustainability. He served as the head of the Massachusetts Department of Environmental Protection, then went on to form Second Nature with John Kerry. Second Nature’s flagship project – the American Colleges and Universities Presidents Climate Commitment (ACUPCC) has been profound: So far 684 college and university presidents have signed a pledge to become carbon neutral, by 2050 at the latest. How did he get this level of support for something as radical as carbon neutrality? Over Area 4 pizza Tony told the tale.
Tony began with a preamble: Clearly the cards are on the table: Climate change is happening at an alarming rate and no government leaders are willing to tackle the issue, nor are corporations. They seek only to maximize profits. Universities may be the last bastions of hope for rational action on behalf of the planet that benefits us all. But to date academic silos have been exacerbating the problem. Engineers build often without consideration of interactive results; economists calculate returns narrowly… leaving externalities out of cost-effectiveness calculations. Without a coordinated effort, there’s no chance of educating the next generation.
So Cortese went back to college, got his doctorate at Harvard, and then hatched a plan. He wanted to see if he could appeal to thought leaders in academia on bridging disciplines to enable a truly sustainable society. He convened a focus group of university officials. They agreed with Tony and endorsed the idea of a pledge. ACUPCC was born, and it had teeth. Signatories are committed to specifying a date, preparing a plan to fulfill the commitment, and to taking action. Tony said that when they kicked out 40 universities for not abiding by their commitments, there was shock. But more signed on, recognizing the role of academia in climate protection and rational behavior on the part of humankind.
We ate more, enjoying an unusually warm and bright fall day in Cambridge. The story continued: Tony and others then realized the need for a trade association, and they went on to form AASHE, the Association for the Advancement of Sustainability in Higher Education. It now convenes colleges and universities across the country… its annual conference in Portland, Oregon this week. EcoMotion has three staff attending.
Clearly Tony Cortese and his cohorts have made huge changes. I congratulate him, expressing openly admiration for his career path and career impact. And it’s far from over: Tony is now focused on the $400 billion in college and university endowments. To do so he has formed the Intentional Endowments Network so that this vast pool of money is used for positive pursuits, certainly for those that do not counter work on sustainability. According to Tony, “It’s all about impact investing.” He intends to provide resources, tools, and facilitate safe convenings on the topic of impact investing for higher education institutions to align missions and sustainability goals.
Global Solar Marketplace 2014
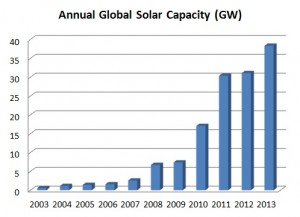 The growth of photovoltaics has been steep. In 2000, there were only 1.5 gigawatts (GW) of PV capacity worldwide. Thirteen years later and by the end of 2013, the global capacity of solar electric systems was 139 GW. The European Photovoltaics Industry Association Global Market Outlook is the source. That’s the peak output of 139 nuclear reactors.
In 2013, global solar capacity increased by 38.9 GW, eclipsing the record-setting levels of 2011 and 2012. Cumulative capacity grew from 40.3 GW in 2010 to 70.5 GW in 2011, to 100.5 GW in 2012, and 138.9 GW in 2013. These gains represent growth rates of 73%, 75%, 43%, and 38% respectively. For the first time, this past year Asia topped Europe and became the predominant region for solar installations with 55% of capacity additions. That said, five forms of renewables were the top forms of generating capacity in Europe in 2013.
While there have been terrific advances, global solar power only represents slightly more than 1% of generating capacity, and about 0.3% of generation. Even in Germany, the world’s leading nation for solar, in 2013 solar only provided 2.6% of all electricity generated and 5.2% of peak demand. Italy leads the pack with 7.8% of total electrical demand provided by solar. Overall, there’s lots of “headroom” for continued growth, huge opportunities to be tapped in the coming decades.
Experts project more than 50 GW of new solar capacity in 2014, and cumulative capacity to triple by 2018. Some say that solar will become the world’s largest supply of energy in 2050, with PV providing a 16% share and solar thermal 11%. (Technically wind is also a form of solar power created by the uneven heating of the Earth’s surfaces.)
For the first time in many years, Germany has lost its stronghold on annual capacity additions. In 2013, China was the leading installer of solar capacity (11.8 GW), followed by Japan (6.9 GW), and the United States (4.8 GW).
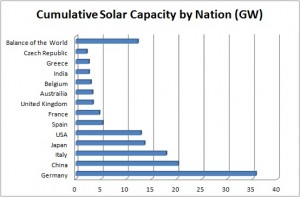 In terms of cumulative capacity, Germany continues to lead, and by a long shot. Its cumulative capacity of 35.9 GW is nearly double that of the next country, China with 19.9 GW. There are now over a million solar systems in Germany. According to Statistica: The Statistics Portal, in third place is Italy with 17.6 GW, Japan with 13.6 GW, and the U.S. with 12.1 GW, less than a third that of Germany.
Policy developments, notably attractive incentives, have dictated the global flow of poly- and mono-crystalline solar panels. Drawn by incentives, the solar market has shifted from country to country. The rise and fall of Feed in Tariffs (FiTs) in the European Union and Asia have driven the growth in the installations and the manufacturing capacity of the market, shifting from Germany to Spain to South Korea and Italy.
Solar in Japan is booming. It may eclipse China as the most lucrative solar market. Thanks to its incentives, Japan’s solar capacity surged 270% in the first quarter of 2013 while European installations dropped by 34% in this same time period. Fukushima has a lot to do with it. Following the earthquake and tsunami that resulted in nuclear disaster in March of 2011, Japan took steps to introduce incentives that reward renewables. The June 2012, FiT incentives were introduced with solar awarded at 53 cents/kWh.
The global solar revolution is on fire… the invisible fire of combustion-free energy. We live in exciting times, times in which solar is growing in leaps and bounds, out of the closet, ready for prime time, now a legitimate resource that is supporting campuses across the country. Some say that 2013 may have been the year that solar “went mainstream.”
U.S. Solar Highlights 2014
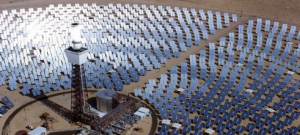
Concentrated Solar Power
Today, a new solar system is installed in the United States every 3.2 minutes. It was every 80 minutes in 2006. By the end of 2013 there were 440,000 homes and businesses that had gone solar in the United States. For residences, the leasing market is robust, with no money down and a viable hedge against future utility bills while taking steps to lower carbon footprints.
In the United States, solar was second only to natural gas in terms of new generating capacity, with 4,751 MW of PV and 410 MW of CSP capacity added in 2013. And solar capacity grew by a whopping 418% from 2010 to 2014, according to U.S. EIA April 2014 Electricity Market Update. Nearly 10 GW of solar was installed in America in four years.
The growth rate is fantastic. The U.S. solar market punched through the 10 GW threshold in mid-2013. Then, by the end of the second quarter of 2014, solar reached 15,900 MW according to SEIA/GTM Research, U.S. Solar Market Insights 2014.
The domestic market is made up of three segments: Net energy metered solar PV, Utility-scale solar PV, and concentrating solar power (CSP). Utility scale solar is coming on strong, with 5,564 of the total in this large-scale segment, with most installations in California. In the second quarter of 2014, there was more utility-scale capacity installed than net energy metered: 625 MW vs. 508 MW of net energy metered capacity.
Today’s combined solar capacity of 15.9 GW represents a 1.13% capacity share. Measured in July 2014 for the prior 12 months, total solar power generation of 14.84 million kWh was 0.36% of U.S. consumption. So there’s lots of headroom for solar capacity. And prices continue to drop, 9% on average in 2013. Now the average installed cost of solar in America is $2.73/DC watt; $3.92 for residential installations.
Campus Solar Leadership 2014
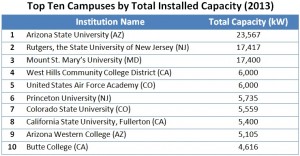 Solar electric systems have found their way to college campuses, big time! Arizona State University deserves the spotlight with a record 23.6 MW of solar! Rutgers and Mount St. Mary’s hold the second and third solar positions on campus. This is best documented in the AASHE Solar Database sponsored by EcoMotion.
http://www.aashe.org/resources/campus-solar-photovoltaic-installations/
In 2013, there were 35 new campus solar projects installed for a total capacity of 17.6 MW and an average capacity of 533 kW. These included the 2 MW Oregon Institute of Technology system, and another 8,017 kW at Rutgers in New Jersey. New data for 2014 shows 8 new installations, including the 4 MW University of the Virgin Islands array. Visit the AASHE database to see a number of “top 10 lists” that highlight campus accomplishments.
Campuses across America are utilizing rooftops, fields, and parking lots to generate electricity from the sun. Some are using solar to fulfill carbon neutrality pledges, such as Butte College that claims to be “grid positive.” University presidents, facilities staff, professors, students, and alumni are praising the benefits of solar energy. Campuses have become “living labs” for clean technologies. Thanks to the maturation of the solar industry, including; technology, financing mechanisms, and project management, solar on college campuses has grown in leaps and bounds.
In 2012, Princeton University energized its 27-acre, 5.3 MW system. Princeton’s system is made up of 16,500 Sunpower panels, 80% of which are on trackers. The system will supply 5% of the University’s needs, and after 8 years when Princeton takes ownership and retains the SRECs, it will account for 6% of the carbon footprint reduction required to meet the commitment to reach 1990 levels by 2020. Sunpower also offered Princeton employees $2,000 rebates for household installations.
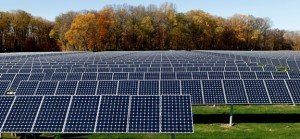
Princeton’s Solar Field utilizes SunPower T0 Trackers
Elementary, middle, and high schools are also benefitting from photovoltaics on campus. Hundreds of schools across the country are benefactors of utility-sponsored solar programs. Under contract with the City of Santa Monica, EcoMotion worked to get solar installed on every elementary school there.
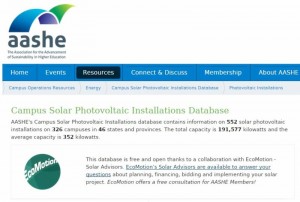
The AASHE solar database is a repository for campus solar systems. Working with its member institutions, and sponsored by EcoMotion, the database has detailed information on 552 solar installations on 326 campuses at colleges and universities in 46 states. In each case, universities and colleges self-report solar system details for the benefit of the AASHE membership.
The total capacity of the 552 installations is 191,577 kilowatts, nearly 192 MW. The average system capacity is 352 kilowatts. Thus far, 155 developers and 169 installation companies have been hired for this work. For colleges and universities, 2011 was a banner year with 44,402 kW installed.
So which states have the most campus solar? California and Arizona with their abundant solar insolation, lead the country with 59.3 MW and 50.5 MW respectively. New Jersey, thanks to its incentive structure, is third with 47.7 MW installed. Maryland and Colorado are fourth and fifth.
In related news, Texas A&M has announced its plan to develop a 50 MW solar field, integrated with its Center for Solar. The University’s aspiration is to be “the premier destination for the study and advance of solar energy.” The $600 million field will be privately financed to generate 100% of campus use, while providing power for an additional 20,000 homes. This campus’s goal to be the world’s largest research center for the evaluation, development, and testing of solar technologies.
Campuses are going solar across the country, in many cases recognizing the opportunity to link solar developments with student education. It’s happening in many ways, from online tools to internships. Initiatives to tie facilities improvements to student life ranges range from kiosks to lectures to full-scale degree programs, to participating in the U.S. DOE Solar Decathlon. In addition to offsetting energy use and carbon, colleges and universities are finding that solar systems provide value at levels above and beyond their power generation.
The EcoMotion / AASHE Special
 EcoMotion is an “honest broker” of solar systems, with no financial ties to suppliers of any kind. We provide solar advisory services for cities, corporations, and campuses coast to coast.
In partnership with AASHE, EcoMotion provides Solar Advisory Services to members. AASHE members across America are entitled to up to eight hours of no-cost consulting to support solar developments on campuses.
Custom consulting takes many forms, from financial analysis to curricular integration. Call the AASHE Solar Hotline at (949) 450 – 7155 for more information and support.
Reactive Power: kVAR and the Foam on the Beer
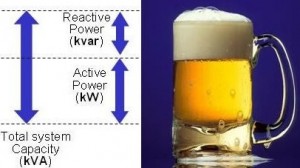 It’s hard for most of us to get a grasp of reactive power, measured in kVAR. For electrical engineers, it’s the foam on the beer, a somewhat distasteful aspect of the electricity equation… and a part that most don’t understand. Is it more like good cholesterol?
I’m deep into it… having carefully avoiding it for years. But I needed to learn about reactive power. It was time dig in and to get comfortable with some electrical engineering, a lagging power factor in particular, and fixing it! Why? A 1.73 MW solar system in New York that we have managed is built and ready for interconnection, but to do so might have cost more than twice what had been estimated and allocated.
The issue in this instance is that there is not enough reactive power on the grid in our fingers of the local utility’s distribution network. Like good and bad cholesterol, an electrical system needs to have a balance of real and reactive power. In this instance, there is already an imbalance and adding more real power will exacerbate the imbalance. Transformer banks were the order of the day, albeit expensive. Another solution, one that was ultimately approved, is to decrease the real power and increase the reactive power. This is results in a beneficial power factor adjustment. As such, our power plant will be shoring up the local grid, providing voltage support.
Let’s back up. When power is generated at a conventional power plant, its power factor is 1, or unity. When that power runs through most resistive appliances, the power factor remains at unity. But when power hits an appliance with complex electronics – like a compact fluorescent lamp – the load is both resistive and inductive, and the power factor is less than unity.
Power factor impacts cause poor power quality for other users in the area. Some industries pay a penalty – in the form of a kVAR (reactive power) charge – to compensate the grid for how they messed up the nicely balanced real and reactive power.
The solution for the solar system in New York is to reduce the power factor of its output from unity, to 0.95 capacitive (the opposite of inductive). This is done by reprogramming the inverters, of which there are 76 “string inverters.” Doing so will allow for a cost-effective interconnection. But it will also reduce the system’s kW output by 5%.
So our solar system will be an asset in the distribution system… shoring up kVAR where critically needed. But who pays for this? Seems like the utility could, but that was not offered. Had we installed “addressable” inverters, we could have adjusted power factor up or own in real time. Doing so would not only help the grid, but allow for full production when the power factor is not an issue. This kind of real-time, power factor control is common for power plants.
At the end of the day, equipment is on order and interconnection will take place shortly. Unfortunately, changing the power factor will cause a 5% decrease in energy generation. While power factor problems are penalized, reactive power from distributed generation is not rewarded. The solar developers will not be getting any credit for pumping kVAR into the grid. But a solution was found to assure that solar can power the school community, effectively interfacing with the local utility for common benefit.
Visiting Noribachi’s Custom LED Manufacturing Facility
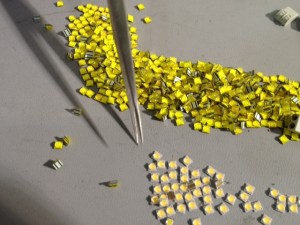
Sorting diodes at the Noribachi facility
Light Emitting Diodes (LED) are all the rage. They have come of age and represent one of the profound gains in energy efficiency of the current era. This week EcoMotion took our staff meeting into the field, to a custom-LED manufacturing facility right in the middle of Los Angeles, in Hawthorne, California.
At the plant diodes are strategically placed on a Common Lighting Unit (CLU) based on a specific customer lighting requirements including efficacy, exact color temperature, beam angle, and CRI. Since Noribachi custom-engineers everything, no order is too small. Noribachi ships thousands of custom-made lighting products every month.
LEDs can save 75% in outdoor applications where high intensity discharge lights are replaced, and typically 50% in interior applications where tubular and CFLs are replaced with LEDs. Noribachi retrofitted the stadium at Bucknell University and realized 80% savings.
A thorough tour: We saw a litany of products and lighting applications; everything from streetlights to massive stadium lights to recessed can LED retrofits. Efficiency gains in Noribachi’s LEDs have boosted dramatically, from 80 – 90 lumens per watt to 139 lumens per watt in two years. We learned that some high-end LED products have reached 160 – 180 lumens per watt.
It’s quite an assembly facility; a great example of “just-in-time manufacturing.” It relies on local ingenuity and labor. Rather than order completed fixtures from Asia, Noribachi assembles to order in Hawthorne. There are no time-related delays. There is no inventory. Customers like SpaceX can stipulate light intensity, light color, and the light distribution of the light source… its throw in a room or outdoor application. Noribachi has a complete metal shop, SMT machines and an assembly team to manufacture products. When an order is placed, it goes in a queue, and in most cases delivered in less than four weeks.
One of the great efficiency gains for LEDS is that they are directional. Unlike other light sources that push light out the sides and back of fixture, LEDs are 100% focused on pushing photons forward. This can be a 20% efficiency gain on its own. LEDs are so efficient at directing light, that some of Noribachi’s customers now want at least a little light thrown at the ceiling for effect. This is easily accommodated.